Many city and municipal governments are struggling to balance budgets (most have balance budget requirements unlike the federal government) in the wake of this recession. Tax reveune is down and government spending is naturally high given that more citizens qualify for income assistance programs during tough economic times. The balance budget requirements of local governments handcuff cities into raising taxes and/or cutting government services at that absolute wrong time. Hence, many local and state governments are getting creative about how to raise taxes. As the state of PA contemplates legalizing table games, cities desperate for revenue are trying anything, like taxing college tuition.
http://www.nytimes.com/2009/12/16/education/16college.html
Given that most schools get federal funds and students at the University of Pittsburgh, for example, receive over $4500 per student in funding from the state of Pennsylvania, it does show some ingenuity on the part of Pittsburgh city planners to try and siphon off federal and state funds back to the city's budget. But at what cost? The city is going to take a lot of heat from a potentially vocal constituency that often has a lot of time on its hands.
A more equitable tax on students might be to tax university endowments and the profits of the for-profit colleges and universities. The University of Pittsburgh has one of the nation's largest endowments for a public university (yet they still enjoy a significant taxpayer subsidy from PA residents). I'm sure Carnegie Mellon's endowment is considerable too. State owned universities and community colleges have little or no endowment and get a considerable amount of their funding from state taxpayers.
Also, just in principle, I would be bothered by the fact that my tax dollars that partly fund higher education across the state would be siphoned off by the city of Pittsburgh to pay for retired city employees.
Wednesday, December 16, 2009
Tuesday, December 1, 2009
Dubai
The following financial market commentary was written by Matt Malick and Ben Atwater of Atwater Malick LLC. Ben and Matt have developed a sound and unique investment philosophy for their clients. They regularly write market commentaries and I plan to post them here for interested followers. You can learn more about them at www.atwatermalick.com .
In many ways, Dubai was the ultimate example of the debt-fueled excesses that led to the global financial crisis as it rapidly expanded infrastructure, transportation systems and residential and commercial real estate. Now that the global economy has slowed and the availability of credit has contracted, Dubai’s state-run companies are seeking to delay the repayment of debt, which many traders essentially view as a default.
We are following the situation as it unfolds, in particular as it relates to the long-term investment thesis behind each of our “focus list” stocks. Although global stock markets have sold-off in response to the news, losses have been relatively modest thus far, and we are not making any immediate changes in our client portfolios. Frankly, outside of potential portfolio exposure in financial stocks, we expect the direct impact of the these events on our companies to be nonexistent. But, the indirect effects on the financial markets are indeterminate and impossible to predict. Any action at this time would be emotional rather than enlightened.
For those of you who are interested in learning more about Dubai, here are links to an excellent two-part 60 Minutes story from August of 2008, when Dubai’s growth was at its peak. We find it particularly entertaining to watch this report with the benefit of hindsight.
http://www.cbsnews.com/video/watch/?id=4312234n&tag=contentMain;contentBody
http://www.cbsnews.com/video/watch/?id=4312039n&tag=contentMain;contentBody
Thursday, September 17, 2009
The "Largest" Unregulated Negative Externality
Most of the significant, and even some of the not too significant, negative externality problems have been identified and regulated in some way. We still debate the proper type and role of regulation, but at least we have made attempts at internalizing the costs of many pollution problems, second hand smoke, drunk driving, noise, and even dog poop. But there is one negative externality that has gone relatively untouched as far as attempts at regulation and that's obesity. Some cities have regulated the use of trans fats in cooking. The next step may be to tax the negative externality causing products, products high in high fructose corn syrup.
The economic argument is pretty straight forward. A negative externality is a cost bestowed on a party who did not participate in the original market transaction. In economics, these costs are referred to as external costs and should be considered a cost of production just like land, labor, and capital. If I decide to drive my gasoline powered car, I incur private costs such as the gas, car maintenance, depreciation, risk of an accident, etc. But I also create an external cost in that the emissions of CO2 and NOx from my tailpipe add to the greenhouse effect and smog. This external cost is an important cost when calculating the social cost of my behavior and if unaccounted for, constitutes a market failure. Obesity also has private and external costs. The existence of external costs means that obesity creates a market failure too.
One way to change my behavior about driving too many miles in my car, is to tax gasoline. The tax should be equal to the damage (external cost) caused by me consuming that gallon of gas. Although the demand for gas, and food for that matter, is fairly inelastic, people may still respond by reducing their consumption.
Yes, like taxes on gasoline, taxes on food are regressive (the poor would pay a larger portion of their income on these taxes) so there are equity concerns. However not all food would be taxed and maybe other income security policies could mitigate some of the distributional issues. However from an efficiency standpoint, taxes on foods and beverages high in sugar make the most economic sense.
Proposed Tax on Sugary Beverages Debated
The debate over a
The tax would apply to soft drinks, energy drinks, sports beverages and many juices and ice teas, but not sugar-free diet drinks.
President Obama has said it is worth considering. The chief executive of Coca-Cola calls the idea outrageous, while skeptics point to political obstacles and question how much of an impact it would really have on consumers.
But a team of prominent doctors, scientists and policy makers says it could be a powerful weapon in efforts to reduce obesity, in the same way that cigarette taxes have helped curb smoking.
The group, which includes the New York City health commissioner, Thomas Farley, and Joseph W. Thompson, Arkansas surgeon general, estimates that a tax of a penny an ounce on sugary beverages would raise $14.9 billion in its first year, which could be spent on health care initiatives. The tax would apply to soft drinks, energy drinks, sports beverages and many juices and iced teas — but not sugar-free diet drinks.
The group’s review of research on the topic, appearing in The New England Journal of Medicine, was released on Wednesday, the same day that Senator Max Baucus, the Montana Democrat, made public his health care reform plan, with an estimated cost of $774 billion over 10 years. The Baucus plan would be paid for by an array of taxes and fees on high-end group insurance plans, drug and medical device makers, and other sources, with no mention of any tax on sugary beverages.
The scientific paper found that a beverage tax might not only raise revenue but have significant health effects, lowering consumption of soda and other sweet drinks enough to lead to a small weight loss and reduced health risks among many Americans.
The study cited research on price elasticity for soft drinks that has shown that for every 10 percent rise in price, consumption declines 8 to 10 percent.
John Sicher, the publisher of Beverage Digest, a trade publication, said that a two-liter bottle of soda sells for about $1.35. At 67.6 ounces, if the full tax was passed on to consumers, that would add 50 percent to the price. A 12-can case, which sells today for about $3.20, could rise by $1.44, a 45 percent increase.
“A one cent per ounce tax would create serious problems and potentially adversely impact sales for the American beverage industry,” Mr. Sicher said.
The proposed tax faces a formidable hurdle in Congress, where several members have voiced strong opposition and few if any have said more than that they would be willing to consider it.
The soft drink industry has adamantly resisted the notion that its products are responsible for a national increase in obesity or that a tax would help curb the problem.
And even a supporter of a beverage tax said it was not clear if it would have a direct effect on the waistlines of Americans.
“I think we should be satisfied that soda taxes would be having a modest effect on consumption but would generate billions of dollars that could be used to mount public health campaigns,” said Michael Jacobson, executive director of the Center for Science in the Public Interest, an advocacy group that favors such a tax.
He said that if the tax was levied on the manufacturers of the sugary drinks they might be able to spread the cost among many of their products, from chips to granola bars to diet sodas, which would keep sugary drink users from feeling the full impact.
Nonetheless, discussion of the tax has the beverage industry on the defensive.
Muhtar Kent, the chief executive of Coca-Cola, was asked about the tax on Monday during an appearance at the Rotary Club of Atlanta and he responded by calling it “outrageous.”
“I have never seen it work where a government tells people what to eat and what to drink,” Mr. Kent said, according to a report by Bloomberg News. “It if worked, the Soviet Union would still be around.”
The industry began to coordinate its response in June when it created an organization called Americans Against Food Taxes.
On its Web site, nofoodtaxes.com, the group calls itself “a coalition of concerned citizens” opposed to “the government’s proposed tax hike on food and beverages,” including soda and juice drinks. Calls to a media contact listed on the site reach the American Beverage Association, an industry organization whose board is made up of top executives from the major soft drink manufacturers.
Americans Against Food Taxes bought a full-page ad last Sunday in The Washington Post. It was fashioned as an open letter to Congress, saying “Don’t tax our groceries.” It has also been running commercials on cable networks, including CNN, MSNBC and Fox News, according to Kevin W. Keane, senior vice president for public affairs at the beverage association.
Mr. Keane said that the association was heading the antitax group and that the beverage industry was paying for its activities.
He took exception to any efforts to single out sugary drinks in the fight against obesity.
“When it comes to losing weight, all calories count, regardless of the food source,” Mr. Keane said. “The bottom line is that the tax isn’t going to make anybody healthier. It’s not going to make a dent in a problem as complex and serious as obesity, and we’re certainly not going to solve the complexities of the health care system with a tax on soda pop.”
Talk of a soda tax is just the latest headache for an industry that has been struggling with flat or declining sales for many products, from sodas to bottled water.
Across the country, many schools have removed soda vending machines saying they should not be plying children with sugary drinks.
Last month, the American Heart Association urged people to reduce their intake of sugary foods and beverages to lower the risk of conditions like obesity and high blood pressure — singling out soft drinks as a prime culprit.
Even President Obama has voiced a cautious openness to the tax.
“I actually think it’s an idea that we should be exploring,” he said, in a recent interview in Men’s Health magazine. “There’s no doubt that our kids drink way too much soda. And every study that’s been done about obesity shows that there is as high a correlation between increased soda consumption and obesity as just about anything else.”
But Mr. Obama acknowledged that there would be significant resistance to such a tax.
Kelly D. Brownell, the lead author of the study and director of the Rudd Center for Food Policy and Obesity at Yale, said in an interview that a penny-an-ounce tax would have an immediate and powerful impact on the nation’s elevated obesity rate.
He said that a tax was justified in part because conditions like obesity and diabetes are often treated with public funds through programs like Medicaid and Medicare. Revenue from the tax could help pay for such care.
Acknowledging how difficult it would be to get a tax through Congress, he said state or local governments could take the first step.
That would follow tobacco, which has been heavily taxed by states in an effort to reduce smoking and defray the costs of smoking-related illnesses.
Representative Bill Pascrell Jr., a Democrat from northern New Jersey, who supports a soda tax said that House lawmakers had considered including it as part of their health reform bill but decided it was too divisive. “It didn’t look like we had the votes,” he said.Friday, September 11, 2009
Economics of Misbehaving in School
Great piece from NPR's Planet Money. The Economics of Misbehaving
To behave or make mischief? For many school kids it comes down to a kind of cost-benefit analysis. Act out and get noticed? There are rewards associated with being popular or the class clown. This Planet Money report focuses on the inner economic life of students.
http://www.npr.org/templates/story/story.php?storyId=112739889
Tuesday, September 8, 2009
Seven Consensus Opinions
The following financial market commentary was written by Matt Malick and Ben Atwater. Matt and Ben recently started their own firm, Atwater Malick LLC. Matt was a student of mine and has a really insightful take on what's happening in the market. Ben and Matt have developed a sound and unique investment philosophy for their clients. They regularly write market commentaries and I plan to post them here for interested followers.
“We are standing by a wishing well / Make a wish into the well / That's all you have to do / And if you hear it echoing / Your wish will soon come true.” – Snow White, from Snow White and the Seven Dwarfs (1937)
Today we are examining what we perceive to be the most widely held consensus opinions among business journalists, economists, analysts, and investment managers. Below are seven thoughts that nearly everyone seems to agree on regarding the present market and economy:
1) “The American consumer will never be the same.”
Clearly, the average American’s personal balance sheet has taken a significant hit over the last couple of years with lower home values and diminished investment accounts. Americans have also accumulated bloated home equity and credit card debt, and now a rising unemployment rate is adding insult to injury. But, it is also true that many Americans have now deferred substantial spending for nearly a year. Consumers have cut clothing purchases and vacations, neglected to update household necessities, haven’t replaced aging cars or upgraded housing. It is difficult to quantify this pent-up demand, but it could uncoil like a spring.
We would also venture to say that spending has become ingrained in our national culture, for better or worse. While a higher national savings rate would be a healthy long-term phenomenon, you can’t change a zebra’s stripes and we are not convinced that Americans will sustain high savings.
2) “A ‘V’ shaped recovery will not happen.”
As the United States has emerged from previous recessions, GDP growth has gone from a negative reading to an above-average annual reading because many people and businesses defer purchases during a recession and manufactures and retailers permit inventories to deplete. When we begin feeling more comfortable, we tend to start buying again. But after this recession, most observers predict that we will emerge with below-trend GDP growth, i.e. less than 3% annual growth in the year after the recession; whereas a “V” shaped recovery would lead to annual GDP growth of 5%-plus during the ensuing year, which is more in-line with other post-recession periods. There will undoubtedly be a struggle between the competing forces of postponed purchases and the need to save more.
3) “The federal deficit is out of control and will only get worse and worse and worse.”
The prospects are certainly dim, but with an improved economy and structural changes on the revenue and expenditure side, hope is not lost. Many people do not fully understand the federal budget. The vast majority of federal expenditures can be attributed to Medicare, Medicaid, Social Security and national defense. Moderate, but intelligent, structural changes in these four areas can go a very long way toward changing our long-term fiscal outlook. Couple this with improving GDP growth, which leads to an expanding tax base, and the federal budget takes on a different complexion. Don’t forget, ten years ago, the Treasury was running budget surpluses and even “retired” the 30-year bond as a funding mechanism. Unfortunately, this turned out to be a Brett Favre-like retirement.
4) “The stock market has rallied too far, too fast, and September is historically the worst month for the market. Watch out below!”
We are somewhat skeptical because nearly everyone thought and still thinks that the market will lose substantial ground in the near-term (i.e. a 20% correction). Investors most likely withdrew funds from the market in anticipation of this predicted swoon. If decent economic news prevails and asset managers think they are missing something, they will undoubtedly flood more money into the market.
We agree that the market rally is overdone for certain speculative stocks. But, in our view, quality is still underpriced in this market. There are many legendary franchises “on sale” with price-to-earnings ratios below fifteen times and dividend yields is excess of 3%.
5) “Problematic inflation is nearly inevitable as a result of the immense fiscal and monetary stimulus.”
This viewpoint is wildly inconsistent with the other opinions on this consensus list, but many people hold them in concert nonetheless. If a weak economy were to prevail for the foreseeable future, the probabilities favor a deflationary environment, not an inflationary one. Post-bubble periods are indicative of deflation, i.e. the United States in the 1930s and Japan in the 1990s.
The Federal Reserve and other central banks around the world have the tools at their disposal to fight rising core inflation, as long as the political will exists. However, if we do experience a more robust recovery, we believe that commodity-driven inflation is a distinct possibility. We foresee inadequate capacity in world commodity supplies to support even modest worldwide economic growth.
6) “Unemployment will exceed 10%.”
This is certainly looking highly probable. But in a note to clients at the near-term market bottom on March 9, 2009, we wrote:
“While it is impossible to predict the precise future of labor markets, we can all but guarantee that the unemployment rate is going to get worse, probably considerably so, before it gets better. But what does this imply for the markets? As Mark Twain said, “History doesn’t repeat itself, but it does rhyme.” Our last truly dire economic situation was in the early 1980s when unemployment was not only high, but inflation was also rampant. In November of 1981, the unemployment rate crossed the 8.0% mark to land at 8.3% (similar to today [March 9, 2009]). At that time the Dow was trading around 850. Over the next 14 months, unemployment continued to rise, finally peaking at 10.8% in November and December of 1982. While the Dow temporarily dropped to around the 800 level, the stock market took off while unemployment continued to rise. By the end 1982, an awful year for employment in the U.S., the market was over 1,000 and it never looked back.”
If history does indeed rhyme this time around, we would not expect a market decline strictly as a result of a rising unemployment rate. However, if unemployment does continue to rise over the next 6-12 months, it will inevitably be a roadblock to a sustainable economic recovery.
7) “Commercial real estate is the next shoe to drop.”
We find it amusing that only a small handful of market pundits were able to predict the first shoe that dropped (residential real estate), but now, all of the pundits believe they can predict the next shoe to drop.
Contrarian investing does not mean disagreeing with every opinion in the marketplace. Without a doubt, we expect some of the above consensus predictions will come to fruition. But, we are highly skeptical that all of these will ultimately materialize. Overall, our reading of sentiment is that many people continue to be very negative on the economy and the markets. To us, this means there is still opportunity to make smart, long-term investments that precede future money flows into the stock market.
View our previous market commentaries at www.atwatermalick.com.
Wednesday, August 26, 2009
Federal Budget Forecasts and Amnesia
The national debt is expected to grow by approximately $9 trillion over the next ten years according to the Obama Administration's own forecasts. The Concord Coalition recently projected a 10 year debt of closer to $14 trillion. Either way you look at it, these are historically large numbers but numbers that often lack political and historical context when discussed in the media by political operatives.
Many Republicans are quick to criticize the President for these large deficits but always fail to suggest what the deficits might be had they controlled the White House and Congress. Maybe the Republicans believe they could have helped us get out of the longest recession since the Great Depression by spending only $8 trillion, maybe $7 trillion? Pick a number. No doubt Democrats would take the opportunity to criticize Republicans for spending too much.
No matter how you slice it, federal deficits increase during a recession if only because tax revenues are down and automatic stabilizers like unemployment compensation and other income security programs increase. Throw in a large tax cut for households and businesses, and I have no doubt that Republicans would be facing a very similar budget outlook. Recent evidence suggests this might be true.
During the Bush Administration, the national debt increased from $5.67 trillion on 9/30/2000 to $10.02 trillion on 9/30/2008 (http://www.treasurydirect.gov/govt/reports/pd/histdebt/histdebt.htm). During his presidency, Bush's budgets averaged over $350 billion in deficits and added over $2.5 trillion to the national debt (http://www.whitehouse.gov/omb/budget/fy2010/assets/hist01z1.xls). Yet during most of this period, the Bush Administration presided over a growing economy and a soaring stock market until the last year of his term. I also recall Bush Administration spokespeople boasting about the millions of jobs created during his term. So how is it that his presidency left us with a national debt almost twice as large as when he took office? It took 40 years to create the deficit Bush began office with and only 8 years for it to double. Did Republicans forget about that? President Obama hasn't even had a chance to reside over a growing economy yet. I'm not trying to deflect the discussion or defend our current administration, the looming national debt may very well be the catalyst for our next crisis and we need to get real about the idea of raising taxes.
Politicians and political pundits are blessed with amnesia, it's the only logical explanation besides suggesting that they blatantly misrepresent the facts or manipulate the truth.
Looking Back on the Economic "Tragedy"
We’ve heard about the potential causes. We’ve cast blame. Now we are trying to sort out the guilty from the innocent. And we all seem to know who to point the finger at, you know “those guys” who caused all the problems. But besides the Madoff’s and Stanford’s, the AIG’s and Fannie Mae’s, who else should we blame? You? Me? Maybe we all should look in the mirror, not because we are negligent, but because we are human.
It’s human nature to want to improve one’s quality of life. For some, a better quality of life might be to live simply and sustainably off the land, for others a better quality of life is a Harvard education, a seven figure salary, and a summer house in the mountains. Economics has nothing to say about whose quality of life is better, nor should a free society. But what economics does say is that everyone has the same underlying objective and that people will, more often than not, make decisions in ways that help them achieve their version of a better life. This is what the study of economics is really about, how do we achieve all of our wants, goals, and desires for our families, our communities, and our planet with the limited resources that we have to work with? It is a difficult and never ending problem, you might even call it a curse, but it’s what defines us as humans.
As we go through life making choices, we evaluate costs and benefits, both present and future. One of the costs that we are always taking into account is the value (price) we place on risks. Hence, it’s logical to expect people to respond predictably to incentives regarding the price of risk. And herein lies the economic tragedy.
Except for a short period defined by the tech bubble recession and September 11th, the nation’s economy was strong for about 18 years. Since the end of 1991 and until recently, unemployment was never higher than 7.5%, the Dow has grown 215%, per capita personal disposable income is up over 45%, prices have risen on average 1.8% per year, and median home values are up 40%. Historically, the last two decades were pretty good and the relative consistency of these numbers over this extended period led many to believe it could be sustained. “Housing prices always go up,” we were told. “The stock market always returns an average of 8% in the long run,” said investors. Couple this notion with subtle deregulatory policy changes and for many decision makers, the cost of taking on more risk went down.
Businesses took on more risk. Banks took on more risk. Homeowners took on more risk and consumers took on more risk. Some took on the risk of growing too fast, borrowing too much, investing too blindly, and insuring too little. Some risks were naively underestimated while others were fraudulently manipulated and too make matters worse, most were unaware of the “tragedy” that was taking place.
As businesses and consumers evaluated the cost of taking on added risk in their own personal decision making, they underestimated the cost caused by others in the economy doing the same thing. Since so many people were taking on added risk, the real hidden cost of risk to the individual decision maker was much higher. Many were making decisions without taking into account the added cost to everyone in the economic system and the tragedy was inevitable.
Like a wild fire, the economy began to burn out of control. Those who miscalculated or manipulated the cost of risk the most were almost immediately eliminated. Others got caught up in the inferno as it spread. But like the aftermath of a forest fire brings new life to the forest floor, the financial crisis appears to be extinguished and as stated by Bernanke “green shoots” are starting to appear.
What should we take away from our latest economic crisis? Like Hardin argued in 1968, some regulation is necessary to protect the commons. He poignantly referred to it as “mutual coercion, mutually agreed upon” meaning that even free markets need publicly agreed upon rules (coercion) that need to be enforced (agreed upon) even though we may not like it.
It’s human nature to want to improve one’s quality of life. For some, a better quality of life might be to live simply and sustainably off the land, for others a better quality of life is a Harvard education, a seven figure salary, and a summer house in the mountains. Economics has nothing to say about whose quality of life is better, nor should a free society. But what economics does say is that everyone has the same underlying objective and that people will, more often than not, make decisions in ways that help them achieve their version of a better life. This is what the study of economics is really about, how do we achieve all of our wants, goals, and desires for our families, our communities, and our planet with the limited resources that we have to work with? It is a difficult and never ending problem, you might even call it a curse, but it’s what defines us as humans.
As we go through life making choices, we evaluate costs and benefits, both present and future. One of the costs that we are always taking into account is the value (price) we place on risks. Hence, it’s logical to expect people to respond predictably to incentives regarding the price of risk. And herein lies the economic tragedy.
Except for a short period defined by the tech bubble recession and September 11th, the nation’s economy was strong for about 18 years. Since the end of 1991 and until recently, unemployment was never higher than 7.5%, the Dow has grown 215%, per capita personal disposable income is up over 45%, prices have risen on average 1.8% per year, and median home values are up 40%. Historically, the last two decades were pretty good and the relative consistency of these numbers over this extended period led many to believe it could be sustained. “Housing prices always go up,” we were told. “The stock market always returns an average of 8% in the long run,” said investors. Couple this notion with subtle deregulatory policy changes and for many decision makers, the cost of taking on more risk went down.
Businesses took on more risk. Banks took on more risk. Homeowners took on more risk and consumers took on more risk. Some took on the risk of growing too fast, borrowing too much, investing too blindly, and insuring too little. Some risks were naively underestimated while others were fraudulently manipulated and too make matters worse, most were unaware of the “tragedy” that was taking place.
In 1968, Garrett Hardin, a biologist, wrote one of the most cited and read economic articles of all time, The Tragedy of the Commons. In the article, he used simple mathematics and logic to explain how a community with open pasture land (commons) would eventually fall apart because individual farmers were simply making economic decisions to improve their way of life. Each rancher saw that adding one steer to the open pasture yielded benefits greater than costs because the costs were shared by the community. The problem was that individual farmers were not accurately taking into account the hidden costs to the commons. Since all the ranchers were making the same decision, the costs were much higher and eventually there were too many cattle for the pasture to sustain.
As businesses and consumers evaluated the cost of taking on added risk in their own personal decision making, they underestimated the cost caused by others in the economy doing the same thing. Since so many people were taking on added risk, the real hidden cost of risk to the individual decision maker was much higher. Many were making decisions without taking into account the added cost to everyone in the economic system and the tragedy was inevitable.
Like a wild fire, the economy began to burn out of control. Those who miscalculated or manipulated the cost of risk the most were almost immediately eliminated. Others got caught up in the inferno as it spread. But like the aftermath of a forest fire brings new life to the forest floor, the financial crisis appears to be extinguished and as stated by Bernanke “green shoots” are starting to appear.
What should we take away from our latest economic crisis? Like Hardin argued in 1968, some regulation is necessary to protect the commons. He poignantly referred to it as “mutual coercion, mutually agreed upon” meaning that even free markets need publicly agreed upon rules (coercion) that need to be enforced (agreed upon) even though we may not like it.
Thursday, August 20, 2009
How Much Should You Pay for that Chocolate Bar?
Have you heard about this economic news? Can you imagine our beloved, sweet-tooth-curing, sugary snacks becoming more expensive?
The story describes a bit of a political standoff between some of the major American food manufacturers and the United States government. Companies, such as Hershey and Kraft, want the government to increase sugar import quotas. This would allow more foreign-made sugar to be imported into the United States (it is important to note that the U.S. already imports a hefty amount of sugar from Mexico, but there is no quota, due to NAFTA). The result would be greater competition and lower prices on sugar.
More importantly, this story is a great tie-in to my earlier post, "The Economics of Price Gouging." It also relates directly to Mike's February post called, "Buy American."
In particular, the sugar quota, just like any trade quota or tariff imposed by a government, represents a PRICE FLOOR. In essence, what the government has done is created an artificial, minimum price that is above the equilibrium price of the sugar market. Now, the government didn't set a specific price, but the current quota limits the amount of sugar suppliers available to Hershey, Kraft, and the like, and keeps the price at a level greater than what the food manufacturers and confectioners would normally pay in a free market. the domestic sugar price has no chance of coming down because government has restricted competition.
Now, the argument used by food manufacturers and confectioners, is that there is a shortage of sugar, due to the quota system. This is faulty economic thinking. Sugar manufacturers were quick to point out that there is plenty of American sugar to buy. OF COURSE THERE IS! Government has created a market where prices are artificially high. The suppliers who CAN benefit from those high prices are quick to supply more sugar.
The problem is NOT a SHORTAGE of sugar. The problem IS that GOVERNMENT is keeping prices at a level that Hershey and Kraft don't want to pay.
- For what reason? To protect American sugar producers.
- Who pays the price? We do, with higher prices at the grocery store cash register.
The Price of Everything

I just finished reading a great book for anyone wanting an easy read about basic economic logic. The book is not a text but a fictional narrative about a college student who stands up to a big box retailer who appears to be price gouging following an earthquake. The student is befriended by the provost of the university who is an economist and they have conversations as the student nears graduation and his valedictorian speech to the student body.
The main story in the book goes great with Bill's posted economics lesson on price gouging.
The book contains some great ideas for teaching economics and is a pretty good story that will keep readers interested. I recommend the book for high school economics and college principles courses.
The Price of Everything: A Parable of Possibility and Prosperity
by Russel Roberts
Princeton University Press (July 28, 2008)
Wednesday, August 19, 2009
So what about these “green shoots”? Are they ever going to grow?
Much has been made about Ben Bernanke’s “green shoots” but not much is heard about when they might turn into trees. Are there any signs that the economy is recovering?
The short answer is, thankfully, yes. But like a gardener needs to meticulously tend to green shoots, especially in the early stages of growth, the economy’s “gardeners” need to do the same.
Over the last few months, much of the optimism for the economic recovery has centered on key macroeconomic variables that show they are slowing down in their rate of decline. Normally we wouldn’t be all that happy over continued job loss or negative industrial demand, but right now we need to take baby steps.
In recent surveys of economists and business leaders, most respondents seem to be a little more optimistic about a recovery than just a couple of months ago. Slightly more than half feel that the economy has hit bottom while some still feel that the recession will extend into 2010. Either way, the forecast has improved. I, too, am optimistic that the worst is over and here are a couple of reasons why.
Better Balance Sheets: Both households and businesses have been putting a lot of emphasis on improving their balance sheets. Consumer credit outstanding has declined steadily since its high in July 2008. Some of this could be the result of defaults and write-offs and as long as unemployment remains high, continued write-offs are expected. But lower consumer debt is also coupled with a steady increase in savings deposits over the same period. In addition, consumers’ financial obligations ratio, a ratio of household financial obligations as a percentage of disposable income, has also declined to 18.5% and is back to a level not seen since 2004. Given the economic uncertainty, many businesses and consumers have put off major purchases. Like consumers, many businesses have been aggressive at lowering costs to maintain margins. Many firms are holding historically high levels of cash just waiting for opportunities to invest.
An Inevitable Durable Goods Cycle: As consumers feel more at ease with their household finances and as unemployment stabilizes, as many believe it will, consumers will begin to replace durable goods. Businesses will also take the opportunity to use their cash to prepare for the next expansionary cycle by upgrading factories, redesigning stores, and preparing new product displays. These events precede an economic recovery so look for firms to increase spending on infrastructure and marketing.
Cheap Money: The Federal Reserve has continued a policy of maintaining low interest rates and high bank reserves. These policies have already helped the financial sector recover and will be a catalyst for growth once consumer confidence improves.
Low Inflation: Nothing helps a recession end like the recession itself. As consumer and industrial demand declines during a recession, commodity prices, producer prices, and consumer prices fall. This helps firms manage the bottom line and helps them make strategic investments in preparation for the next cycle. Consumers welcome the relief of lower prices as they struggle to manage household finances.
Now, I wouldn’t be an economist worth my weight in salt if I didn’t stop here and say, “but on the other hand” (that’s why Truman asked for only one-armed economists). There is one key variable in this discussion that will make all of this more difficult to achieve in the short term and that’s unemployment. Nothing will improve consumer confidence more than a decline in unemployment. Not only does lower unemployment indicate that we are putting people back to work, it helps those who were afraid of losing their job feel a little more confident about the immediate future. This will have a tremendous effect on the speed of the recovery.
Of course there are many other variables that I haven’t discussed that may play a role in this recovery like the effectiveness of fiscal stimulus, large federal deficits, inappropriate government intervention, and the global economic recovery. But that’s why I love teaching economics, always new things to talk about.
Monday, August 10, 2009
ECONOMICS LESSON: The Economics of Price Gouging
Given the current economic climate in the United States, many citizens are worried about their financial well-being. When citizens are confronted with rising prices on staple products, necessary items, and generally inelastic goods, they turn to the media, government, or anyone who will listen to their complaints. We see reports in the newspaper, or on television, about "price gouging" and unsympathetic businesses hurting middle class America. But is so-called "price gouging" really a bad thing? Or, is government control of prices really doing more harm than good?
This clip by John Stossel of ABC's 20/20 was made in the wake of Hurricane Katrina. But its message and reasoning are founded in Adam Smith's view of a free market economy, and certainly apply to America's current economic situation. It offers a great introduction to the topic of price ceilings and government intervention in the economy.
So, what is a PRICE CEILING?
So, what is a PRICE CEILING?
- A price ceiling is a legal maximum price that can be charged for a good or service.
- When a price ceiling is set below the equilibrium price, it will cause shortages.
- Price ceilings occur when government is dissatisfied with the outcomes of free markets.

 When government limits the price of rental units to $400 per month, the suppliers are only willing to provide 3000 units. The market, on the other hand, is demanding 6000 units. As you can see, the Rent Ceiling, represented by the red line, has resulted in 3000-unit shortage. In addition, when 3000 units are available to rent, consumers are willing to pay $625 per month. Since the price established by government is only $400, landlords are experiencing a loss of $225 per month, per unit. That is a $675,000 loss per month by all property owners in this market.

- Some questions to think about...
- What are some additional economic and societal effects of this situation?
- How might third-parties be affected by this?
- Government can also set prices greater than the equilibrium price created naturally by the market. This type of price control is known as a PRICE FLOOR and results in surpluses. Suppliers are willing to supply at the artificially high price, but consumers won't buy.
- Government doesn't have to set a specific price for shortages or surpluses to occur. Interventions such as trade barriers, tariffs, and subsidies can have the same effect.
Monday, June 29, 2009
Change in Funding for Higher Ed in PA
Interesting article and comments. I've posted about the relationship between the 14 state-owned universities and the 4 state-related universities before. Take a look at the comments - most taxpayers still do not understand this relationship.
http://chronicle.com/news/article/6706/in-42-million-blow-governor-removes-4-pa-universities-from-bailout-bid?utm_source=at&utm_medium=en&commented=1#c043298
Also, as a result of the changes to PA's Right to Know Laws, the financial statements for Penn State are public record for the first time (despite billions of dollars in state subsidies). http://www.scribd.com/full/16134763?access_key=key-1mkep44zfcrcimzsk0rs
Tuesday, April 28, 2009
Mutual Fundosaurus
The following financial market commentary was written by Matt Malick and Ben Atwater. Matt and Ben recently started their own firm, Atwater Malick LLC. Matt was a student of mine and has a really insightful take on what's happening in the market. Ben and Matt have developed a sound and unique investment philosophy for their clients. They regularly write market commentaries and I plan to post them here for interested followers.
For many years, stocks have been a common method of building financial wealth. When purchased at a fair price and sold at a full valuation, stocks can produce stellar returns. In fact, even after the recent equity bear market, the S&P 500 has returned 7.41% annually over the past 20 years ended March 31, 2009 with dividends reinvested in the index.
Because of strong potential returns, stocks have gained ever greater popularity over the years, and the financial services industry has responded by devising clever ways for the “average” investor to participate in the stock market. These include common trust funds, mutual funds, variable annuities, exchange traded funds (ETF’s) and hedge funds. Along the way, the industry created countless other financial products as well. Some have stood the test of time and others have not.
As the famous investor Barton Biggs reminded us in a November 11, 2008 Fortune article, “there is no asset class too much money can't spoil.” While he was referring to hedge funds, we think this adage also applies to mutual funds. The first mutual fund was organized in 1924 as a method of pooling investors’ assets together to purchase a diversified portfolio of individual stocks. Early mutual funds allowed “small” investors to own a diversified basket of equities at a time when it was not yet cost-effective for everyday folks to directly purchase and monitor individual stocks. In exchange for limited transparency and control, mutual fund clients gained diversification and professional oversight of their portfolios.
Over the years, there have been dramatic changes in both the mutual fund industry and the options available to individual investors. The charts below show the explosion of mutual funds and of mutual fund assets in the United States.
 Source: 2008 Investment Company Institute Fact Book
While the mutual fund industry has grown exponentially, technology and the Internet have expanded the options available to individual investors. Through the advent of discount online brokerage sites, retail investors are now able to purchase individual stocks for modest commissions. And thanks to the free flow of information through the Internet, investors and independent investment advisors can more easily access vast amounts of pertinent data about publicly-traded companies, including all Securities and Exchange Commission regulatory filings. Therefore, the opportunity now exists for individual investors to directly own interests in the companies that mutual funds are frequently trading.
So why are mutual funds still so widely used? We think a clue lies in the flow of mutual fund assets. As you can see from the charts above, total assets invested in mutual funds at the end of 2007 were roughly $12 trillion. But according to data from the 2008 Investment Company Institute Fact Book, total sales of mutual funds throughout 2007 were $24 trillion – almost twice the level of assets. Now that is salesmanship.
You can partially attribute this to the natural ebb and flow of money in the economy. Fortunes are accumulated and spent, funds are redeemed to pay for financial goals, and new millionaires are made each day. But in our view, the vast majority of this phenomenon can be attributed to (1) the transactional incentives built into the financial services industry and (2) performance chasing.
As you know, mutual funds are the tool of choice for most financial salespeople. These funds often carry hefty expense ratios and sales loads and can therefore be highly profitable when the salesperson closes a deal. Unfortunately, the profitability of a transaction sometimes ranks higher on the priority list than simplicity, transparency, and prudent advice.
According to a study called the Quantitative Analysis of Investor Behavior by financial research firm Dalbar, from January 1, 1988 through December 31, 2007, the average equity fund investor earned an annualized return of only 4.5%, while the S&P 500 returned 11.8%. We think this is attributable to “performance chasing,” a common reason investors churn mutual funds. This occurs when an investor sells a poorly performing fund in favor of the hottest performing fund. Reversion to the mean and Murphy’s Law dictate that the purchase of this “best of breed” fund will happen at exactly the wrong time, right before the fund starts to underperform.
Wednesday, April 15, 2009
Cell Phones for the Poor
Following discussions about social insurance programs in my Public Finance course, a student emailed me a news item about a government program to provide cell phones for the poor. I had never heard of such a program but after a simple Google search, I found Safelinkwireless.com.
During my search to find out more, I came across many negative comments about how this is just another wasteful government program. Many were concerned about how much it would cost taxpayers and some seemed to already know that the phones would be going to the same people who cheat and defraud other welfare and income security programs. I also read many statements saying that having a cell phone is a luxury and not a right. Some of my students shared these same sentiments.
Let's look at this public assistance program using positive economic analysis (objective and scientific).
What's the estimated cost? In Tennessee, one of the states offering the program, there are 800,000 estimated eligible people. The phone can be bought in most grocery stores for $20 and then there is the cost of the 42 minutes per month. Even if we assume the government is paying retail for the phone, I'm going to guess that 500 minutes per year would cost no more than $50. So for $70 per person per year or $56 million for all of the eligible people in Tennessee (assuming they all sign up), the people already qualifying for some level of government assistance would have a free cell phone.
I beleive that if you really try to estimate the productivity and cost saving benefits that you have personally experienced using your own cell phone and then multiply that by hundreds of thousands, you might agree that there are significant potential benefits from a program like this. Take a look at this paper: http://www.newmillenniumresearch.org/archive/Sullivan_Report_032608.pdf
Will there be people getting a cell phone in this program who are not deserving? Sure, that's a predictable and quantifiable cost of any government assistance program but we cannot get caught up in the relatively small number of individuals who try to game the system - it's just another cost. We should always try to minimize fraud and abuse (again if benefits outweigh costs), but if the benefits still outweigh the costs, then the program generates a net gain and both the size of the economic pie and the distribution of the pie are arguably better than before.
Sunday, March 15, 2009
Could It Be?
The following financial market commentary was written by Matt Malick and Ben Atwater. Matt and Ben recently started their own firm, Atwater Malick LLC. Matt was a student of mine and has a really insightful take on what's happening in the market. Ben and Matt have developed a sound and unique investment philosophy for their clients. They regularly write market commentaries and I plan to post them here for interested followers.
Could It Be?
As investors, we are constantly asking ourselves tough questions. Lately we have been grappling with the unthinkable.
Could it be that the major credit rating agencies will continue their abysmal predictive record?
Standard & Poor’s, Moody’s and Fitch are the three primary bond rating agencies and have enormous influence over Wall Street. The highest rating they bestow is Triple-A. As enablers of the great financial crisis that we are now facing, these agencies rated sub-prime mortgage-backed securities and collateralized debt obligations as Triple-A based on the ridiculous models that their firms created.
These firms once rated The American International Group (AIG) as a Triple-A credit, all the while AIG piled on mind-boggling obligations through credit default swaps (CDS), which last quarter led to the largest loss in American corporate history - $61.7 billion.
Without these colossal errors, our economy would be in a much better position. But, Standard & Poor’s, Moody’s and Fitch are not new to overlooking the elephant in the room. Remember Enron and WorldCom? Enron was rated an investment grade credit right up until the day it declared bankruptcy. WorldCom maintained its investment grade rating until three months before its bankruptcy.
Now these rating agencies are on a downgrading spree, cutting the ratings of vast amounts of mortgage-backed securities, many insurance companies and many banks. In fact, they recently downgraded the debt of both General Electric and Warren Buffet’s Berkshire Hathaway. If their track record holds, then they are likely to be wrong once again.
Could it be true that bears make money, bulls make money and pigs get slaughtered?
Wall Street banks, the rating agencies and the regulators all embraced the concept that thousands of bad mortgages bundled together as one security were transformed into a good security; after all, it was “diversified.” In an already overleveraged economy, faith in the all-encompassing power of broad diversification pushed us over the edge as the Wall Street banks leveraged their balance sheets thirty-to-one and bet the farm on these bogus mortgage-backed securities. Much of this was based on the misguided belief that housing prices could not decline.
Just as speculators participated on the way up to unsustainable heights, we now have others trying to push us down to new lows. The latest game in town is to drive fear about the prospects of certain companies by manipulating the credit default swap market. Credit default swaps are unregulated insurance that will theoretically pay if a company’s bonds default. The higher the premium on a credit default swap, the higher the implied risk that a company will fail. However, the market for these instruments is just small enough that unscrupulous players can create fear. Traders are shorting certain stocks (betting the stock’s price will fall) and then bidding up credit default swaps in an effort to fool the market into thinking that these companies are in irreparable trouble and then profiting handsomely from their short positions.
For example, according to a Merrill Lynch report issued on Friday, March 6th, the credit default swap market was indicating that Warren Buffett’s Berkshire Hathaway had a greater risk of default that the country of Vietnam and that General Electric was at greater risk of default than Russia (a country that actually did default on its debt in 1998).
If the track record of outrageous greed holds, then these scare tactics should ultimately fail. Just this week, many of the stocks that have been victims of this strategy have rebounded strongly. Let us hope that this is a sustainable stock market rally.
Could it be that individual investors are as wrong as ever?
The American Association of Individual Investors released its most recent survey of investor confidence. The survey is the most negative in its twenty-two year history, with 70% of the respondents bearish about the market’s prospects. The last time that 70% of the respondents agreed on something, it was in January of 2000, near the top of the technology stock bubble. At that time, 70% of respondents were bullish on the market’s prospects. Again, let’s hope their track record holds.
Could it be that there are two tiers of financial institutions, the awful and the OK?
The assumption before this week was that every financial institution was fatally flawed. Perhaps this is an overstatement. Of the Wall Street banks, we have thus far found that Bear Stearns, Lehman Brothers and Merrill Lynch were among the awful, but it appears that Morgan Stanley and certainly Goldman Sachs are among the OK. In terms of the super-banks, we know that Citigroup is awful, that Bank of America is perhaps somewhere between awful and OK, but it is increasingly appearing that perhaps Wells Fargo and J.P. Morgan are OK.
If our country truly has a large contingent of OK, i.e. well managed financial institutions, then there will be the opportunity for many positive surprises in the weeks and months ahead, much like we’ve seen this week.
Could it be that stocks are priced appropriately for a bear market bottom?
According to a recent Goldman Sachs study that analyzed the twelve previous bear markets beginning in 1929, assuming a March 2009 end to the present bear market, we are at very normal levels for a bottom. The historical average peak-to-trough price decline was 38%. We reached 56%. The average peak price-to-earnings ratio was 25.6. We reached 22.4 back in October of 2007. And finally, the historical average trough price-to-earnings ratio was 13.9. We reached 13.4.
Only time will tell, but there are numerous questions worth considering. The counter punch is that our economy and our markets are weakening at unprecedented rates with much of the rest of the world in even worse shape. Is this time different?
View our previous market commentaries at www.atwatermalick.com.

Monday, March 9, 2009
Foreign Holders of US Government Debt
I've heard too many misquoted figures lately regarding how much US government debt China currently owns. I've also heard correct figures but without any context. Here are the figures from the end of 2008.
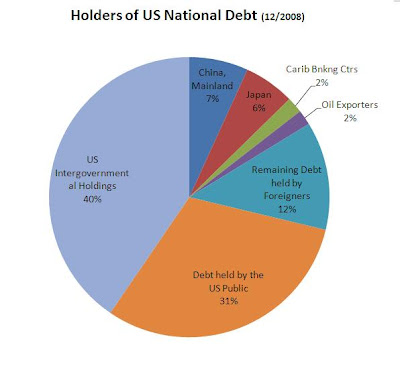 China is the largest foreign owner of US government debt however as a percentage of total outstanding debt, China's stake is relatively small, too small to have any significant effect on the US economy or interest rates.
For an up to date accounting of all foreign holders of US government debt, visit the Treasury's website: http://www.treas.gov/tic/mfh.txt and for a breakdown of the entire national debt visit: http://www.treasurydirect.gov/govt/reports/pd/mspd/mspd.htm
Monday, February 23, 2009
The Fuel for the Financial Crisis Fire
Many of the people I've talked to about the financial crisis like to suggest that the cause for the financial crisis was the change in lending practices of Fannie Mae during the Clinton Administration (1999). Although these changes did increase the risk on the balance sheet of the largest mortgage lender in the US, I don't feel this played a significant role in getting us to where we are now.
The reason, because in 1999 and until April 2004, the amount of capital that could be leveraged by investment banks was capped. However, this rule changed on April 24, 2004 for any investment bank over $5 billion in market capitalization. Banks who qualified were now allowed to almost double the amount of leverage. Who qualified under this little known rule change? Just 5 companies.... maybe you remember them: Bear Sterns, Lehman Brothers, Merrill Lynch, Mogan Stanley, and Goldman Sachs.
So before the rule change, the fuel that could be put on the fire was at least known and limited, after the rule change, the fuel [read potential disaster] almost doubled.
This is a slideshow by the NY Times. What's great about this is the actual audio from the meeting when this rule change was debated and passed.
"The Day the SEC Changed the Game"
http://www.nytimes.com/interactive/2008/09/28/business/20080928-SEC-multimedia/index.html

Friday, February 20, 2009
An Inconvenient Monetary Base?
Recently, a student of mine shared with me a YouTube video of a Glenn Beck (Fox News) piece on... well, that's what I'm not sure about.
You tell me, what's the chart about and what point is Beck trying to make?
http://www.youtube.com/watch?v=C7Xu3xUkpEE
If you said that the chart is about our national debt and Beck is making the point that it's immoral to leave such a large national debt as the one he appears to point to in the chart... well, you are wrong. Join the majority of people who watch Beck and, sadly, I think Beck believes this too. However, I do agree with the point Beck is trying to make about the national debt, if only it had anything to do with the debt.
What Glenn Beck actually has in the unlabeled chart is the "Adjusted Monetary Base and Reserves" from the St. Louis Federal Reserve Bank (go here to see the actual chart: http://research.stlouisfed.org/fred2/series/AMBNS).
The adjusted monetary base is a measure of the currency in circulation and the cash reserves banks have in an account with the Federal Reserve (both required and excess reserves). In essence, this is the Fed's balance sheet, specifically the Fed's liabilities. In September 2008, this measure began to grow faster than during any other time since the beginning of the Federal Reserve System. There are a couple of reasons for the excessive growth in the monetary base since September 2008. First, the Fed has been adding to the excess reserves of banks by buying distressed bank assets and replacing them with Treasury bills. The Fed then engages in open market operations and buys the Treasury Bills, giving the banks excess cash. Hence, what was not on the Federal Reserves balance sheet before the crisis is now on their balance sheet, some of which is in the form of bank reserves. The idea here is that with these excess reserves (instead of "toxic" assets) and added liquidity, the banks will have the ability and incentive to make new loans.
Second, and I feel the most significant factor in the growth of the monetary base, is that the Fed began to pay interest on the reserves of banks starting in October 2008. Before this time, any bank reserves held by the Fed came at a significant opportunity cost because they did not earn interest. Hence banks only kept their "required" minimum reserves in their account with the Fed. Since the change, banks began putting their excess reserves in their Fed account. Why? Well, to earn interest and because the Fed appears to be a much safer place to put money than in the hands of borrowers in such an uncertain economy. Yes, this policy does seem to go against the idea of getting banks to loan money, but the Fed argues that this measure is important in their ability to manage interest rates in this environment (for the Fed's explanation read: http://www.newyorkfed.org/markets/ior_faq.html).
So think about it. If you are a bank and you had excess reserves before this rule change, you might consider loaning the money out to the public or other banks, albeit cautiously. But now that the Fed is paying interest, and although it's not a great return on excess reserves, given the alternative which is to lend to the public in this economic environment, I think I'd go with the Fed too. Hence, the Fed's balance sheet has soared and the Adjusted Monetary Base has soared and that's what Beck had in his chart as he went up his "An Inconvenient Debt" lift.
What's this all mean? Well, for one, this does not have much to do with the national debt which is what I took away from Beck's video. It means that there is a significant amount of bank reserves waiting for some stability in the economy and when that happens, it would be logical to expect banks to lend to the public. With a significant amount of potential lending, there is a risk of inflation but we are a long way from there and the Fed has tools to control the amount of lending when the time is right.
I know, I know... you question the Fed's ability to control or time anything... that will have to wait for another post.
Wednesday, February 18, 2009
Stimulus Bill = Government Jobs for Recent Grads
It is even hard for the experts to predict how many and where new jobs will be created from the stimulus bill. But it seems obvious to me that in order for the government to manage various aspects of the stimulus bill, they will need to hire workers. I think this is one place where job creation is almost certain. I asked one of my students, Jillian Golomboski, to find out some information and here is what she has to report.
With the troubled state of the economy, it is scary as a student to think about attempting to find a job after college graduation. However, the recently passes stimulus bill is predicted to save or create 3.5 million jobs across the US which some people are optimistic about. As a college student in hopes of getting a job after graduation, or as a graduate in the middle of a job search, it would be nice to have a way of finding the government jobs that are being created.
These jobs can be searched for at USAjobs.gov which is a government website that is similar to other job search engines but is specific to government positions. This website is a great place to find new jobs that are opening due to the recently signed stimulus bill. On the site, you can search for a specific position you may be looking for, a certain city you may want to live in, or both. You can also find info about which jobs are currently in high demand. The website allows you to post a resume so recruiters can contact you or you can apply for positions online and send your resume in yourself.
As a member of the site, USAJOBS will keep you updated by sending you alerts and updates on the latest listings. The site will give you tips on searching for jobs so you can find the position you are looking for and the site has guides that can help you with the basic tasks of applying for a job.
In addition, studentjobs.gov is a website that can be helpful for current students. It can help you find internships in both government and non government organizations. It also connects you with different websites to search for careers, many of which are government related.written by Jillian Golomboski
Tuesday, February 17, 2009
Lesson on "Real" vs. "Nominal"
Here's a lesson idea that builds off my post in "More Than Just Invisible Hands" about the hidden shift in state funding for students attending the state system universities (Post on February 7, 2009, "The Hidden Shift in Higher Education Funding").
If you want to adjust a series of current dollar values (a.k.a "nominal") like wages, prices, or investment returns, for inflation (a.k.a. "real"), you first need a price index. A price index is created by taking a basket of goods or services and tracking the purchasing power needed to buy the same basket over time. The basket, theoretically, doesn't change resulting in a consistent measure of inflation. There are many price indices available for use depending on what you want to adjust for inflation. The Bureau of Labor Statisics is a good source for price indices and so is Economagic.
The Consumer Price Index is a common price index used to adjust many statistics for inflation. One example is the Cost of Living Adjustment (COLA), that adjusts the amount retirees receive in Social Security benefits. The purpose of the SS system is to provide retirees with an adequate amount of income to live on consistent (to a point) with the standard of living they had when they retired. If SS benefits were not adjusted for inflation, then the purchasing power of the money they receive would buy less and less over time.
There are other price indices that may be better measures of inflation for specific goods or services. If you were interest in adjusting wages for inflation then you would use the "employment cost index" and you could choose a version of the ECI for the particular occupation or industry.
In the post, I was interested in adjusting the appropriation from the state and the cost of tuition and fees for a general measure of inflation so I chose the CPI for all goods and services in the Mid-Atlantic region (since the data represents PA).
Here is an excerpt from my excel spreadsheet.
FTE = Full Time Equivalent student
As you can see, once you adjust the nominal appropriation for inflation, it starts to fall short of the inflation adjusted value around 1988. By the end of 2008, the two measures are $1600 apart.
To calculate the "real" column, use the following equation:
 where t = year of the inflation adjusted value
By adjusting the data for inflation, we can see that despite the nominal value per student increasing every year, the inflation adjusted value should be much more. In other words, the actual contribution from the state subsidizes a lot less of a college education in 2008 than it did in 1984 and students are paying more for their education.
If you want to adjust a series of current dollar values (a.k.a "nominal") like wages, prices, or investment returns, for inflation (a.k.a. "real"), you first need a price index. A price index is created by taking a basket of goods or services and tracking the purchasing power needed to buy the same basket over time. The basket, theoretically, doesn't change resulting in a consistent measure of inflation. There are many price indices available for use depending on what you want to adjust for inflation. The Bureau of Labor Statisics is a good source for price indices and so is Economagic.
The Consumer Price Index is a common price index used to adjust many statistics for inflation. One example is the Cost of Living Adjustment (COLA), that adjusts the amount retirees receive in Social Security benefits. The purpose of the SS system is to provide retirees with an adequate amount of income to live on consistent (to a point) with the standard of living they had when they retired. If SS benefits were not adjusted for inflation, then the purchasing power of the money they receive would buy less and less over time.
There are other price indices that may be better measures of inflation for specific goods or services. If you were interest in adjusting wages for inflation then you would use the "employment cost index" and you could choose a version of the ECI for the particular occupation or industry.
In the post, I was interested in adjusting the appropriation from the state and the cost of tuition and fees for a general measure of inflation so I chose the CPI for all goods and services in the Mid-Atlantic region (since the data represents PA).
Here is an excerpt from my excel spreadsheet.
| Year | Nominal State Appropriation per FTE student | CPI - PA,NJ,DE,MD | Real or Inflation Adjusted Appropriation per FTE Student |
| 1983-84 | $3,003 | 105.6 | |
| 1984-85 | $3,182 | 110.7 | $3,148 |
| 1985-86 | $3,349 | 112.6 | $3,202 |
| 1986-87 | $3,449 | 118.9 | $3,381 |
| 1987-88 | $3,497 | 125.6 | $3,572 |
| 1988-89 | $3,596 | 129.9 | $3,694 |
| 1989-90 | $3,751 | 139.4 | $3,964 |
| 1990-91 | $3,711 | 144.4 | $4,106 |
| 1991-92 | $3,980 | 147.5 | $4,195 |
| 1992-93 | $3,916 | 151.3 | $4,303 |
| 1993-94 | $4,196 | 155.4 | $4,419 |
| 1994-95 | $4,432 | 159.1 | $4,524 |
| 1995-96 | $4,553 | 164.3 | $4,672 |
| 1996-97 | $4,567 | 166.4 | $4,732 |
| 1997-98 | $4,572 | 169 | $4,806 |
| 1998-99 | $4,736 | 172.9 | $4,917 |
| 1999-00 | $4,869 | 177.5 | $5,048 |
| 2000-01 | $4,921 | 179.9 | $5,116 |
| 2001-02 | $4,842 | 185.3 | $5,269 |
| 2002-03 | $4,575 | 189 | $5,375 |
| 2003-04 | $4,294 | 197.8 | $5,625 |
| 2004-05 | $4,376 | 204.9 | $5,827 |
| 2005-06 | $4,408 | 211.6 | $6,017 |
| 2006-07 | $4,564 | 219.03 | $6,229 |
| 2007-08 | $4,669 | 218.19 | $6,205 |
FTE = Full Time Equivalent student
As you can see, once you adjust the nominal appropriation for inflation, it starts to fall short of the inflation adjusted value around 1988. By the end of 2008, the two measures are $1600 apart.
To calculate the "real" column, use the following equation:
 where t = year of the inflation adjusted value
By adjusting the data for inflation, we can see that despite the nominal value per student increasing every year, the inflation adjusted value should be much more. In other words, the actual contribution from the state subsidizes a lot less of a college education in 2008 than it did in 1984 and students are paying more for their education.
Subscribe to:
Posts (Atom)